Page 1 of 1
[solved] gb.chart
Posted: Wednesday 17th May 2017 3:57am
by Got2BeFree
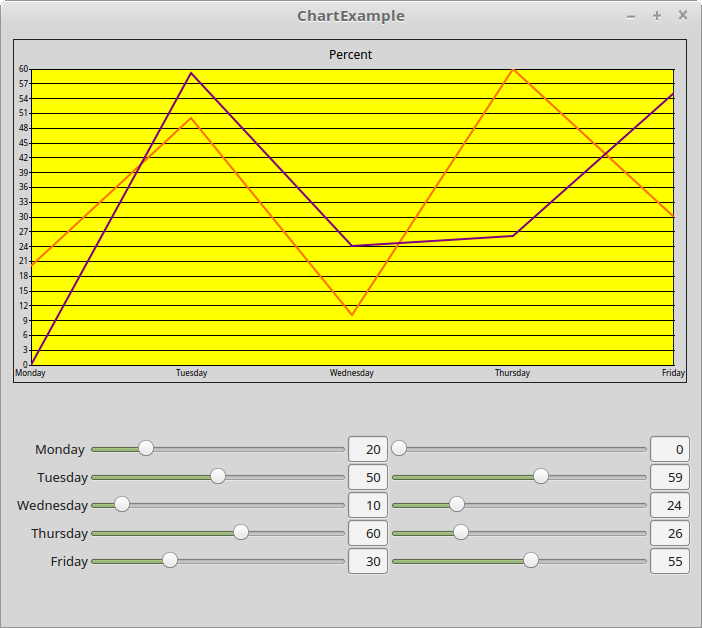
I need to create a graph using data I'm collecting using my RPi. It seems there is very few examples and even less information about the gb.chart component. I can show one line, but I would like to display multiple lines on the chart. Anyone know if this is possible?
Re: gb.chart
Posted: Wednesday 17th May 2017 3:41pm
by cogier
I thought I'd have a go at this and got it working with one line then re-read your post and noticed you wanted 2 lines!

So I had another look and found 'Chart.CountDataSets' which seems to be what you are looking for. I started with some code from here
https://novatocodegambas.blogspot.com/2 ... ficas.html and came up with the attached program.
I hope it helps.
 EDIT: - I have put this program on the Gambas Farm as an example.
Re: gb.chart
Posted: Thursday 18th May 2017 5:48am
by Got2BeFree
Thanks! The .CountDataSets was the missing link! Either I overlooked it or thought it was for some other function. Now on to database mining...