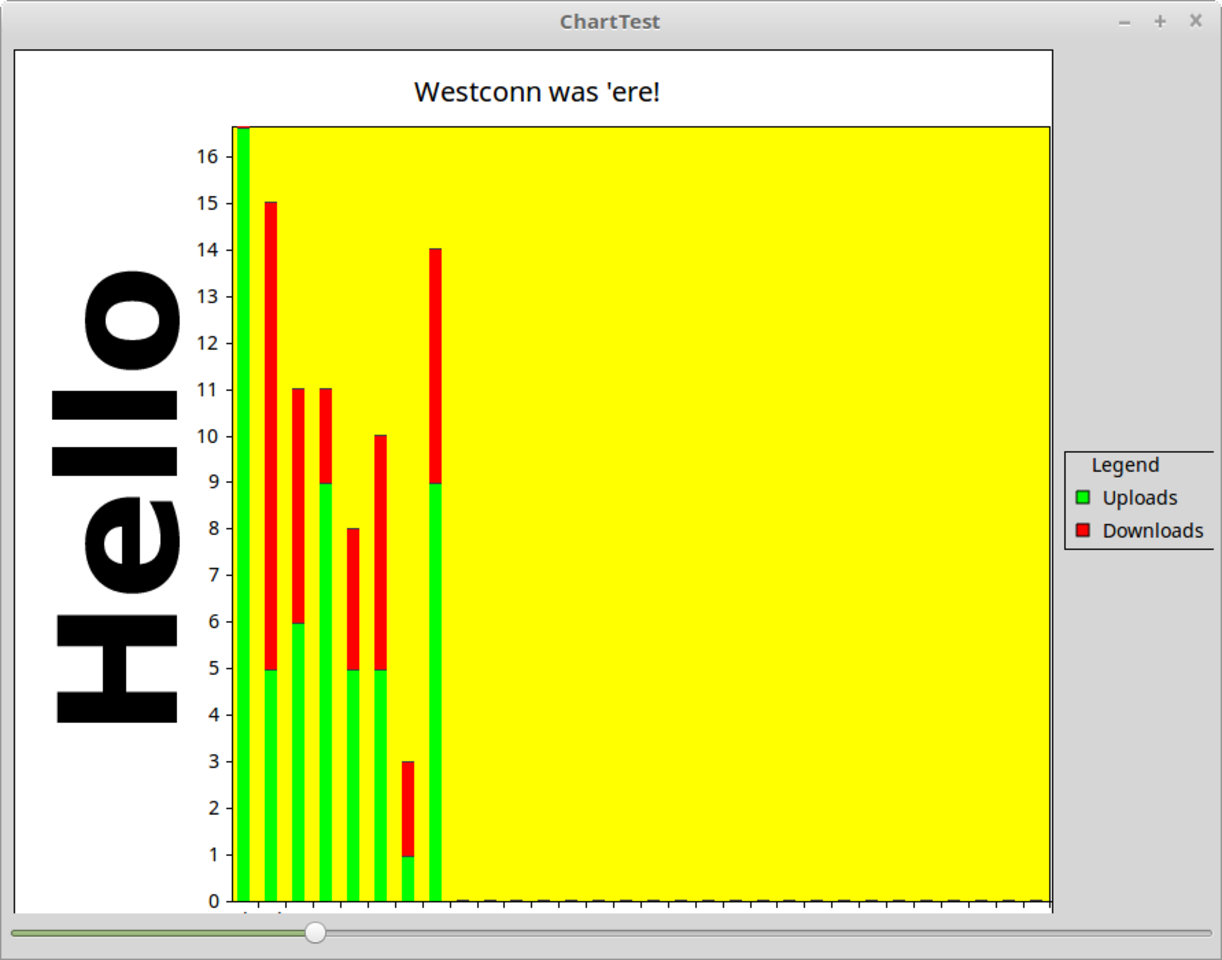
First you need to note that the Chart command has a comment of "This component is not stable yet"
that was about 5 years ago, it looks like the programmer has lost interest in this
here is my code, obviously some stuff is nothing to do with the graph, i will probably move the graphing into a separate procedure later, some comments to explain code for other components not required for testing graph, the code is still a bit messy as i keep trying different things, then do not always remember to remove
Public Sub Form_Open()
Dim s As Float[]
Dim i As Integer, m As Integer
Dim f As File
Dim sfile As String
Dim afile As String[]
Dim aln As String[]
Dim adt As New Date[]
Dim cntofdays As Integer ' number of days in month
Dim rollover As Integer = 3 ' first day of month
cntofdays = DateDiff(Date(Year(Date), Month(Date), rollover), DateAdd(Date(Year(Date), Month(Date), rollover), gb.Month, 1), gb.Day)
' probably comment out the tray stuff for testing
htray = New TrayIcon As "myapp"
htray.Visible = True
htray.PopupMenu = Menu1.Name
htray.Show
'timer at this stage only to hide the form to the tray, later to update the data file
timer1.enabled = True
timer1.Trigger
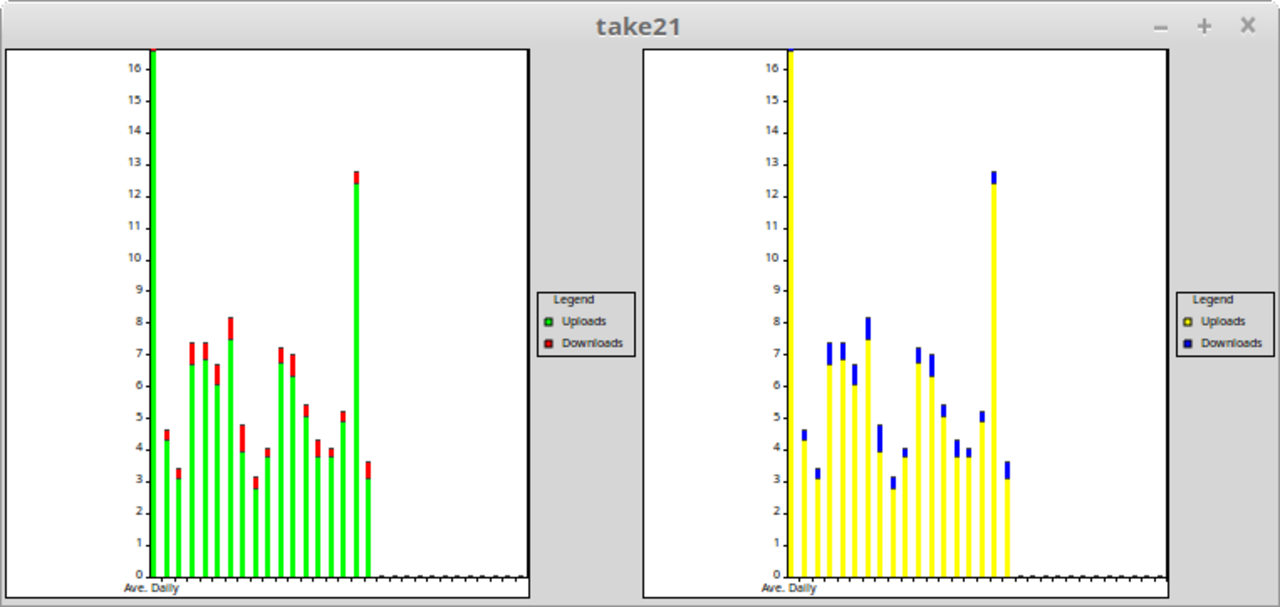
hchart = New Chart
hchart.YAxe.ShowIntervalLines = False
hchart.ShowLabels = True
hchart.Legend.Position = Align.Right
hchart.Legend.Visible = True
hchart.Legend.Title = "Legend"
hChart.type = ChartType.ColumnsStacked
hChart.Legend
hChart.headers.values = ["Uploads", "Downloads"]
hchart.CountDataSets = cntofdays
hchart.Colors.Values = [Color.green, Color.red]
hchart[0].Text = "Ave. Daily"
hchart[0].values = [500 / cntofdays, 0]
hchart.FirstColumnAsLabel = True
sfile = File.Load("/home/pete/code/abbdaily") ' see below
sfile = Trim(sfile)
afile = Split(sfile, gb.NewLine)
For i = 0 To Day(Date) - rollover - 4 ' the data file should always go to todays date, but for testing purposes it is 3 or 4 days old already, will error if dates run out
aln = Split(afile, gb.Tab)
adt.Push(Val(aln[0]))
s = [aln[2], aln[1]]
hchart[i + 1].Values = s
Next
EndPublic Sub DrawingArea1_Draw()
' drawing area on fmain
hchart.Width = Draw.Width
hchart.Height = Draw.Height
hchart.Draw()
End
content of data file
03-06-2018 0.24 4.34
04-06-2018 0.25 3.13
05-06-2018 0.63 6.77
06-06-2018 0.47 6.89
07-06-2018 0.58 6.13
08-06-2018 0.60 7.56
09-06-2018 0.79 4.00
10-06-2018 0.29 2.85
11-06-2018 0.20 3.81
12-06-2018 0.42 6.78
13-06-2018 0.59 6.40
14-06-2018 0.28 5.10
15-06-2018 0.47 3.85
16-06-2018 0.21 3.82
17-06-2018 0.22 4.97
18-06-2018 0.28 12.48
19-06-2018 0.47 3.17
Total Used 6.99 92.04
Used Combined 99.03
Data Left 400.97
Data Left 400.97
on another note, what is maximum delay for timer?