[solved] gb.chart
-
Got2BeFree

- Posts: 104
- Joined: Saturday 26th November 2016 2:52am
- Location: Lost
[solved] gb.chart
I need to create a graph using data I'm collecting using my RPi. It seems there is very few examples and even less information about the gb.chart component. I can show one line, but I would like to display multiple lines on the chart. Anyone know if this is possible?
Last edited by Got2BeFree on Thursday 18th May 2017 5:49am, edited 1 time in total.
sholzy
I'm wondering around lost in the past, not knowing where the present is.
I'm wondering around lost in the past, not knowing where the present is.
-
cogier

- Site Admin
- Posts: 1129
- Joined: Wednesday 21st September 2016 2:22pm
- Location: Guernsey, Channel Islands
Re: gb.chart
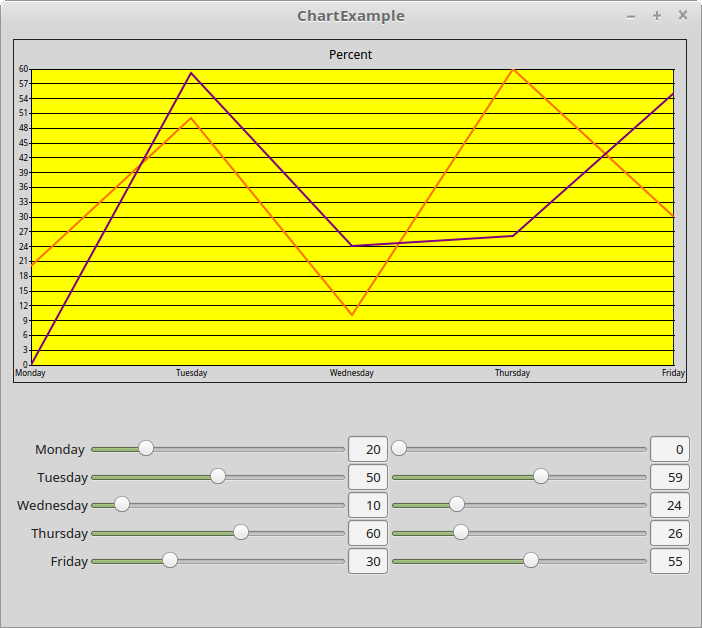
I thought I'd have a go at this and got it working with one line then re-read your post and noticed you wanted 2 lines!  So I had another look and found 'Chart.CountDataSets' which seems to be what you are looking for. I started with some code from here https://novatocodegambas.blogspot.com/2 ... ficas.html and came up with the attached program.
I hope it helps.
EDIT: - I have put this program on the Gambas Farm as an example.
I hope it helps.
 ChartExample.tar
- (54.5 KiB) Downloaded 746 times
-
Got2BeFree
- Posts: 104
- Joined: Saturday 26th November 2016 2:52am
- Location: Lost
Re: gb.chart
Thanks! The .CountDataSets was the missing link! Either I overlooked it or thought it was for some other function. Now on to database mining...
sholzy
I'm wondering around lost in the past, not knowing where the present is.
I'm wondering around lost in the past, not knowing where the present is.